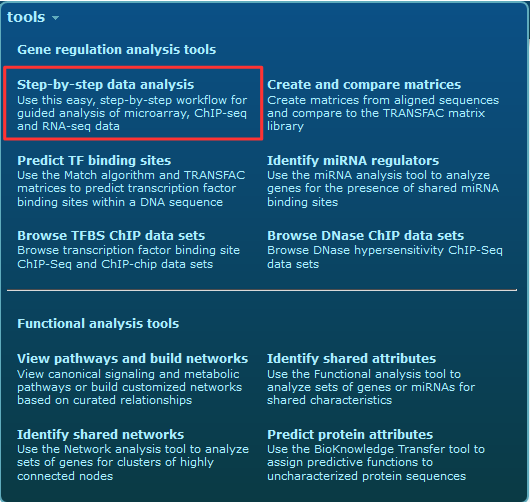
Step-By-Step Data Analysis (TRANSFAC)
The step-by-step data analysis tool in TRANSFAC provides easy-to-use, guided workflows for the analysis of gene-level microarray and RNA-seq data sets, ChIP-seq data sets and transcript-level RNA-seq data sets. At the core of the analysis is an FMatch analysis, which compares hits for transcription factor binding motifs in the analysis set against a background set selected by the user. Depending on the form in which the data are submitted for analysis (gene lists or genomic coordinates which can be mapped to genes) additional types of analyses may be provided: Functional Analysis, Network Analysis and analysis for miRNA targets (see details below).
Please note: Functional Analysis and Network Analysis are subject to subscriptions which include besides TRANSFAC also PROTEOME.
I want to analyze:
1. I want to analyze: Gene-level microarray or RNA-seq data set
The microarray or RNA-seq analysis workflow accepts pre-filtered lists of up- or down-regulated genes, as well as the complete list of genes analyzed in the experiment. When a complete list is used you will be guided through selection of the subset to be used for the analysis. In both cases, your data set should be preprocessed such that the expression values are in standard fold-change (FC) or other format. (Usually log2(FC) is recommended.)
Note: When a list of genes is analyzed, besides the FMatch analysis for overrepresented TF-binding sites, the genes are subjected automatically also to a Functional Analysis, a Network Analysis, as well as a miRNA analysis (for overrepresentation of miRNA targets among the analyzed genes). The gene upload for the step-by-step data analysis accepts genes from human, mouse, rat, rhesus monkey, pig, fruit fly, Arabidopsis, rice, and soybean, as for these the promoter sequences are included in the database as well as a sufficient number of PWMs. However, for rice and soybean the additional analyses are not fully supported, due to lack of pathway data or miRNA data.
A. Pre-filtered microarray or RNA-seq data set
- Upload the pre-filtered microarray or RNA-seq data set to be
analyzed
The gene list can be uploaded in form of gene symbols or identifiers. Optionally, an observation column can be included, which may contain quantitative expression values (e.g. fold change), which can be used to filter the gene list.
- Select the background gene set to be used in the
analysis
For the background the following options are provided:
- A random set of 1000 genes
- A gene set previously uploaded by the user
- Upload of a new gene set
Note: Which of the provided background options is the best may depend on your analysis set and the question which you would like to solve.
- Select the parameters for the FMatch analysis
- Profile (group of matrices)
- Data version
- P-value threshold (default: 0.01)
- Nucleotide region of the gene's promoters to be analyzed (default: -500 to +100)
Note: In total up 10 M bp can be analyzed in the analysis set, as well as in the background set. This has to be taken into account, when the promoter region to be analyzed is selected, e.g. for a background set of 1000 genes this allows maximally 10,000 nucleotides per promoter to be analyzed. However, usually the FMatch results are better for shorter promoter regions around the TSS (e.g. -500 to +100).
B. Complete microarray or RNA-seq data set
- Upload the complete microarray or RNA-seq data set to be
analyzed
The uploaded gene list needs to include an observation column with quantitative values (e.g. log2(FC)), which allow to extract up- or down-regulated genes from the complete set for analysis. After upload the program displays the distribution of the expression values (from the uploaded observation column) with the expression values on the vertical axis.
Example: Uploaded complete microarray data set with log2(FC)
The user can set the thresholds for the up-regulated genes and/or the down-regulated genes, as well as for the non-changed genes to be optionally used as background set, either by typing the value into the respective input box or, for the up- and down regulated genes, by moving the markers at the vertical axis. Underneath the graph the number of genes for the respective data sets is displayed according to the selected thresholds. As the thresholds are adjusted, these numbers are automatically updated. For optimal results usually an analysis set between 20 and 100 genes is recommended. The background set can and should be larger (but more than ca. 1000 genes are not recommended). If both, up- and down-regulated genes are selected for extraction, the genes will be analyzed together. To analyze both, up- and down-regulated genes, separately, the step-by-step analysis needs to be repeated for the respective sub-sets.
- Select the background gene set to be used in the
analysis
For the background the following options are provided:
- A random set of 1000 genes
- A set of non-changed genes from the experiment as selected in the previous step
- A gene set previously uploaded by the user
- Upload of a new gene set
Note: For the analysis of microarray or RNA-seq data it usually makes sense to use a set of non-changed genes from your experiment as background. However, which of the provided background options is the best may depend on a number of considerations, e.g. in case you want to compare the results from different experiments, it could also make sense to use one and the same background set for all analyses.
- Select the parameters for the FMatch analysis
- Profile (group of matrices)
- Data version
- P-value threshold (default: 0.01)
- Nucleotide region of the gene's promoters to be analyzed (default: -500 to +100)
Note: In total up 10 M bp can be analyzed in the analysis set, as well as in the background set. This has to be taken into account, when the promoter region to be analyzed is selected, e.g. for a background set of 1000 genes this allows maximally 10,000 nucleotides per promoter to be analyzed. However, usually the FMatch results are better for shorter promoter regions around the TSS (e.g. -500 to +100).
2. I want to analyze: ChIP-seq data set
The ChIP-seq analysis workflow accepts sequences (FASTA, EMBL, Genbank, or RAW format) or genomic intervals in .bed format which are used to extract the corresponding sequence. Human hg38/GRCh38, mouse mm39/GRCm389, rat rn6/RSGC 6.0, Arabidopsis TAIR10 and fruit fly BDGP6 are supported.
Note: Upload of sequences (in FASTA or similar) provides only analysis of the submitted sequences. If genomic coordinates (for human, mouse, or rat) are uploaded, he coordinates are mapped to the promoter regions (-10,000 to +1,000 relative to the virtual TSSs). Thus, in addition to the analysis of the sequences corresponding to the intervals, the genes located near the ChIP-seq fragments can be subjected to functional analysis (similar as for analysis of microarray data or gene lists).
A. Sequences (e.g. in FASTA)
- Upload the sequences to be analyzed
Upload your sequences, e.g. in FASTA. Upload of files is restricted to 10 MB.
- Select the background sequence set to be used in the
analysis
For the background the following options are provided:
- A set of randomly generated sequences
- A sequence set previously uploaded by the user
Upload of a new sequence set
Note: Which of the provided background options is the best, may depend on your analysis set and the question which you would like to solve.
- Select the parameters for the FMatch analysis
- Profile (group of matrices)
- Data version
- P-value threshold (default: 0.01)
- Nucleotide region of the gene's promoters to be analyzed (default: -500 to +100)
B. Genomic intervals (.bed)
- Upload the genomic intervals to be analyzed
The uploaded genomic coordinates need to be in .bed format. The program supports analysis of up to 10 M bp in total. In case of larger ChIP-seq datasets, a partial data set needs to be submitted.
- Select the background sequence set to be used in the
analysis
For the background the following options are provided:
- Experimental genomic intervals shifted by 1000 bp
- A set of randomly generated sequences
- A sequence or genomic interval set previously uploaded by the user
- Upload of a new genomic interval set
Note: Which of the provided background options is the best, may depend on your analysis set and the question which you would like to solve. To use the option to shift the intervals by 1000 bp has the advantage that the background set will have the same number of intervals with the same size distribution as the analysis set. However, as the majority of the analyzed intervals are to be expected to be located around the TSS, a considerable number of the shifted background intervals could be located within the transcribed region (subject to orientation of the gene, in up to half of the cases). Also, for many of the intervals the association with a gene/promoter may not change, when they are shifted 1000 bp. Therefore, in case you want to compare the genes associated with the fragments between the analyzed fragments and the background, use of another background option could make sense, e.g. comparison against an uploaded ChIP-Seq data set for a different factor.
- Select the parameters for the FMatch analysis
- Profile (group of matrices)
- Data version
- P-value threshold (default: 0.01)
1. I want to analyze: Transcript-level RNA-seq data set
The transcript-based RNA-seq analysis workflow accepts pre-filtered lists of up- or down-regulated Ensembl transcripts, as well as the complete list of Ensembl transcripts analyzed in the experiment. When a complete list is used you will be guided through selection of the subset to be used for the analysis. In both cases, your data set should be preprocessed such that the expression values are in standard fold-change (FC) or other format. (Usually log2(FC) is recommended.)
Note: When a list of transcripts is analyzed, besides the FMatch analysis for overrepresented TF-binding sites, the transcripts are subjected automatically also to a Functional Analysis, a Network Analysis, as well as a miRNA analysis (for overrepresentation of miRNA targets among the analyzed transcripts). The transcript upload for the step-by-step data analysis accepts transcripts from human, mouse, rat, fruit fly, and Arabidopsis as for these the promoter sequences are included in the database as well as a sufficient number of PWMs.
A. Pre-filtered RNA-seq data set
- Upload the pre-filtered RNA-seq data set to be analyzed
The transcript list can be uploaded in the form of Ensembl transcript identifiers. Optionally, an observation column can be included, which may contain quantitative expression values (e.g. fold change), which can be used to filter the gene list.
- Select the background gene set to be used in the
analysis
For the background the following options are provided:
- A random set of 1000 genes
- A transcript set previously uploaded by the user
- Upload of a new transcript set
Note: Which of the provided background options is the best may depend on your analysis set and the question which you would like to solve.
- Select the parameters for the FMatch analysis
- Profile (group of matrices)
- Data version
- P-value threshold (default: 0.01)
- Nucleotide region of the gene's promoters to be analyzed (default: -500 to +100)
Note: In total up 10 M bp can be analyzed in the analysis set, as well as in the background set. This has to be taken into account, when the transcripts to be analyzed is selected, e.g. for a background set of 1000 genes this allows maximally 10,000 nucleotides per promoter to be analyzed. However, usually the FMatch results are better for shorter promoter regions around the TSS (e.g. -500 to +100).
B. Complete RNA-seq data set
- Upload the complete RNA-seq data set to be analyzed
The uploaded transcript list needs to include an observation column with quantitative values (e.g. log2(FC)), which allow to extract up- or down-regulated transcript from the complete set for analysis. After upload the program displays the distribution of the expression values (from the uploaded observation column) with the expression values on the vertical axis.
The user can set the thresholds for the up-regulated transcripts and/or the down-regulated transcripts, as well as for the non-changed transcripts to be optionally used as background set, either by typing the value into the respective input box or, for the up- and down regulated genes, by moving the markers at the vertical axis. Underneath the graph the number of transcripts for the respective data sets is displayed according to the selected thresholds. As the thresholds are adjusted, these numbers are automatically updated. For optimal results usually an analysis set between 20 and 100 transcripts is recommended. The background set can and should be larger (but more than ca. 1000 genes are not recommended). If both, up- and down-regulated transcripts are selected for extraction, the genes will be analyzed together. To analyze both, up- and down-regulated transcripts, separately, the step-by-step analysis needs to be repeated for the respective sub-sets.
- Select the background gene set to be used in the
analysis
For the background the following options are provided:
- A random set of 1000 genes
- A set of non-changed transcripts from the experiment as selected in the previous step
- A transcript set previously uploaded by the user
- Upload of a new transcript set
Note: For the analysis of RNA-seq data it usually makes sense to use a set of non-changed transcripts from your experiment as background. However, which of the provided background options is the best may depend on a number of considerations, e.g. in case you want to compare the results from different experiments, it could also make sense to use one and the same background set for all analyses.
- Select the parameters for the FMatch analysis
- Profile (group of matrices)
- Data version
- P-value threshold (default: 0.01)
- Nucleotide region of the gene's promoters to be analyzed (default: -500 to +100)
Note: In total up 10 M bp can be analyzed in the analysis set, as well as in the background set. This has to be taken into account, when the promoter region to be analyzed is selected, e.g. for a background set of 1000 genes this allows maximally 10,000 nucleotides per promoter to be analyzed. However, usually the FMatch results are better for shorter promoter regions around the TSS (e.g. -500 to +100).
Step-By-Step Data Analysis Result
FMatch Report

The main result of the Step-by-step data analysis is provided in form of an FMatch Report. In those cases, where additional analyses were conducted, links to the respective results (Functional Analysis, Network Analysis, miRNA Analysis) are provided on the top of the page. For up to one week the links to the result pages are also provided on the TASKBAR (see above).
Save this report
The analysis result can be saved on the FMatch Report page: "Save this report". The saved analysis result will be listed under "Match results" in the MY DATA tree. If available, other results of the Step-by-Step Data Analysis are saved together with the FMatch result and can be accessed via the FMatch Report page again, when loaded from the MY DATA tree, i.e. they do not need to be saved separately.
Export this report
The export on top of the FMatch Report exports only the FMatch result (filtered hits in the analysis data set, filtered hits in the background data set, fmatch.out which contains the comparison between the analysis and the background data set). Where available, other, connected results (Functional Analysis, Network Analysis, miRNA Analysis), can optionally be exported from the respective page.
Note: Subject to the subscribed product (PROTEOME) and analyzed data type (i.e. gene lists), Functional Analysis and Network Analysis as well as Ontology Search can also be conducted based on the complete or partial gene list in the FMatch Report.
Contact us at support@genexplain.com