Network Analysis Tool
Introduction
The Network Analysis tool is accessible from the search pull-down menu of the main BKL page by clicking on the Identify shared networks link. If you have not already done so, you will be asked to login to the BKL at this time. The tool provides an on-line interface where subscribers to the on-line version of PROTEOME can submit a list of genes to be analyzed for networks enriched with members of your gene set.
Network Analysis Tool Interface
The Network Analysis tool interface provides users with the ability to select a previously saved list of genes or to upload a new list of genes for analysis.
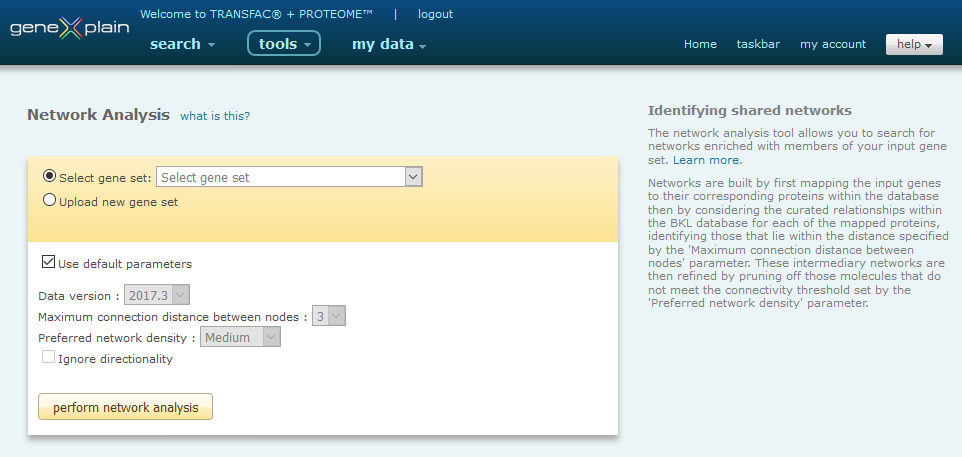
Network Analysis Tool interface
The tool will perform a search for networks enriched with members of your gene set. Once the gene set has been selected, you will have the option to set the parameters of the analysis. Networks are built by first mapping the input genes to their corresponding proteins within the database then by considering the curated relationships within the BKL database for each of the mapped proteins, identifying those that lie within the distance specified by the 'Maximum connection distance between nodes' parameter. These intermediary networks are then refined by pruning off those molecules that do not meet the connectivity threshold set by the 'Preferred network density' parameter. Default parameters have been selected to work with the broadest applications and may be used with no changes unless you wish to optimize the results further for your specific application. If you wish to change any of the parameters, deselect the 'Use default parameters' option and make the desired changes:
Version
As of the the 2013.3 release, in an effort to provide support for data replication for publication purposes, we introduced support for older versions of interaction libraries. The current interaction library is always selected by default, but you may choose to use an older interaction library version as desired.
Maximum connection distance between nodes
This parameter specifies the maximum number of steps that may separate two nodes in the input list. By default the parameter is set to 3, but you may select a distance from 1 to 5. Specifying a smaller maximum connection distance will generally produce more, smaller networks while specifying a larger maximum connection distance will generally produce fewer, larger networks. In general, as you increase the maximum connection distance, smaller networks will become merged into larger networks.
Preferred network density
This parameter specifies the connectedness of a node to other nodes in the network. By default the parameter is set to Medium, but you may select a densities of Very low, Low, Medium, High and Very high. Specifying a lower preferred density favors the retention of nodes and will generally produce larger, more branched networks. Specifying a higher preferred density favors the removal of nodes whose connection to the network is more fragile and will generally produce smaller, more dense networks.
Ignore directionality
This parameter specifies the type of relationships that are considered when building the networks. By default, Ignore directionality is turned off and only those relationships which are unidirectional are considered. Examples of unidirectional relationships include a ligand activating its receptor, a kinase phosphorylating a target proteins, etc. When Ignore directionality is turned off, the set of considered relationships is extended to also include bidirectional relationships. Examples of bidirectional relationships are protein-protein binding interactions which result in bidirectional complex formation. Ignoring directionality will generally produce larger networks and may merge smaller networks into larger networks.
Please note: The tool is restricted to human, mouse and rat species.
Please note: Only one species can be analyzed at a time. If you submit a list of genes that are of mixed species, the tool will select the species with the greatest number of entries and discard the others.
Start the analysis by clicking the Start button.
Network Analysis Tool Output
The BioKnowledge Transfer Tool output is presented as a report. The report contains summary and networks identified sections.
Network Analysis Tool output
Summary
The summary section provides a summary of the analysis that was performed, including the database version used at the time of the analysis. It provides detailed information about how input genes were mapped to their protein counterpart in the database, information about which input nodes were preliminarily part of a network but were removed due to the preferred network density specified, which input nodes have interaction partners within the database but were unable to be placed in a network, as well as which input nodes have no known interaction partners within the database and were thus excluded from the analysis.
Networks identified
The networks identified section provides a tabular view of the networks identified.
The columns of the table are as follows:
- Total network size - Provides a count of nodes within
the network
- Input nodes count - Provides a count of the input nodes
within the network
- Input nodes in network - Provides a list of the input
nodes within the network
- Connecting nodes count - Provides a count of the nodes
within the network that were not part of the input set but were
used by the algorithm to connect the members of the input set
- Connecting nodes in network - Provides a list of the
nodes within the network that were not part of the input set but
were used by the algorithm to connect the members of the input
set
This networks identified section also provides the option to save the report to the my data Data Management system. In the dialog window the Functional analysis -> Analysis results -> Network analysis folder will be automatically selected by default and highlighted in blue, but you may choose to save the report in another folder if desired. After selecting the folder, you will assign an individual name to the stored result.