Functional Analysis Tool
Introduction
The Functional Analysis tool is accessible from the search pull-down menu of the main BKL page by clicking on the Identify shared attributes link. If you have not already done so, you will be asked to login to the BKL at this time. The tool provides an on-line interface where subscribers to the on-line version of PROTEOME can submit a list of genes or miRNAs to be analyzed for the presence of statistically over-represented terms using a basic Fisher test analysis.
Functional Analysis Tool Interface
The Functional Analysis tool interface provides users with the ability to select a previously saved list of genes or miRNAs or to upload a new list of genes or miRNAs for analysis.
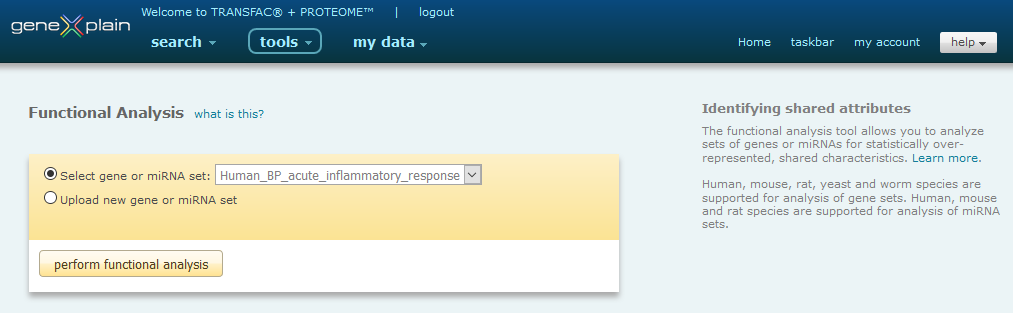
Functional Analysis Tool interface
Once the gene or miRNA set has been selected, the basic Fisher test analysis can be initiated by clicking the Start button.
Please note: Only human, mouse, rat, yeast and worm species are supported for genes and only human, mouse and rat species are supported for miRNAs. Only one species can be analyzed at a time. If you submit a list of genes or miRNAs that are of mixed species, the tool will select the species with the greatest number of entries and discard the others.
Functional Analysis Tool Output
The Functional Analysis Tool output is presented as a report. The report contains a summary, overview of attributes and detailed view of attributes section.
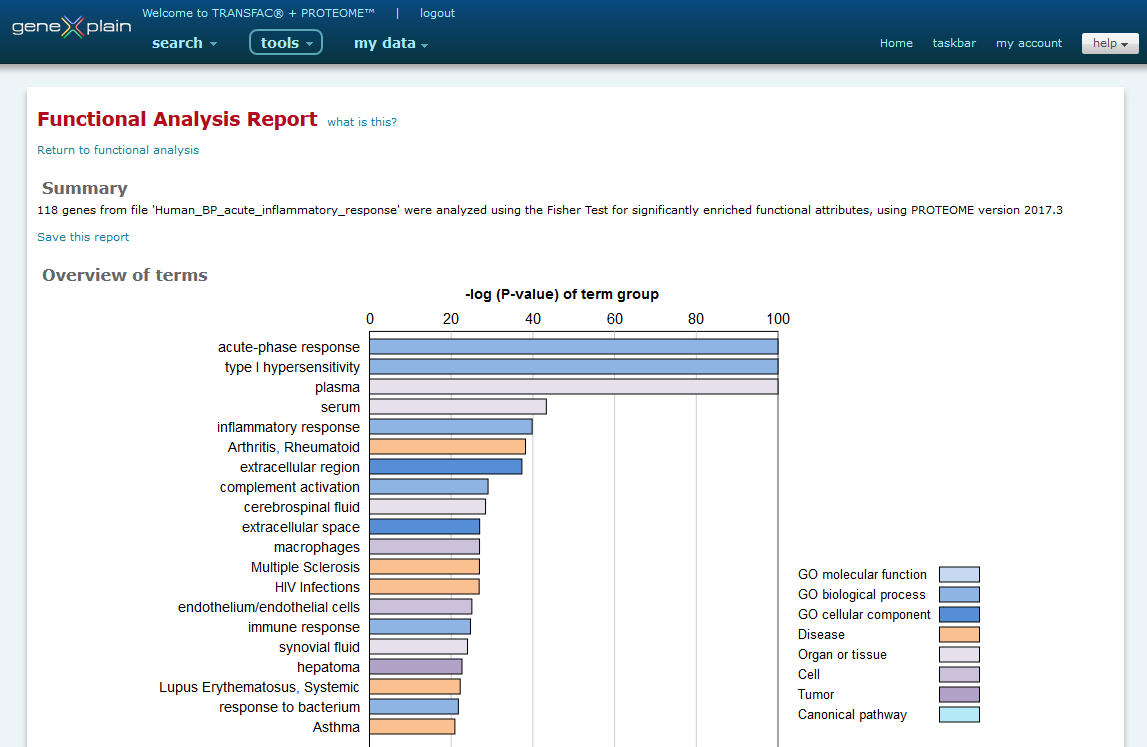
Partial view of Functional Analysis Tool output
Summary
The summary section provides a summary of the analysis that was performed, including the database version used at the time of the analysis. This section also provides the option to save the report to the my data Data Management system. In the dialog window the Functional analysis -> Analysis results -> Functional analysis folder will be automatically selected by default and highlighted in blue, but you may choose to save the report in another folder if desired. After selecting the folder, you will assign an individual name to the stored result.
Overview of attributes
The overview of attributes section provides a graphical view of the 20 most significant attributes identified with the statistical significance of the attribute displayed on the x axis as the -log (P-value) of the attribute group. The categories of the attributes are color coded according to the following legend:
Legend for color coded categories
Longer attribute descriptions may be truncated. Mouse over the attribute to view the complete description.
Detailed view of attributes
The detailed view of attributes section provides the complete list of attributes identified by the analysis organized into a table or series of tables. Two display options are provided: Show attributes organized by category and Show attributes organized by P-value. The attributes are displayed by category by default. An example table is shown here:
Example table for GO biological process
The columns of the table are as follows:
- Attribute - The statistically significant controlled
vocabulary term
- Hits - The number of genes or miRNAs in the input set
which are annotated to the attribute or to a child term of the
attribute
- Expected hits - The number of genes or miRNAs in the
input set that would be expected, based on the size of the input
set and the frequency of the attribute in the database, to be
annotated to the attribute or to a child term of the attribute
given random chance
- Group size - The number of genes or miRNAs in the
database which are annotated to the attribute or to a child term of
the attribute
- P-value - The measurement of statistical
significance
Click the attribute to view the list of genes or miRNAs in the input set which are annotated to the attribute or to a child term of the attribute. Mouse over the gene or miRNA name to view a description of the gene or miRNA, or click the gene or miRNA name to navigate to a detailed report for it. Click the ontology icon to send the list of genes to the ontology search tool for exploring additional shared attributes.