Predicting Transcription Factor Binding Sites with Match, FMatch and Composite Model Search
Use Match, shown below, FMatch and the alternate Composite Model search to predict binding sites for transcription factors in a particular DNA sequence.
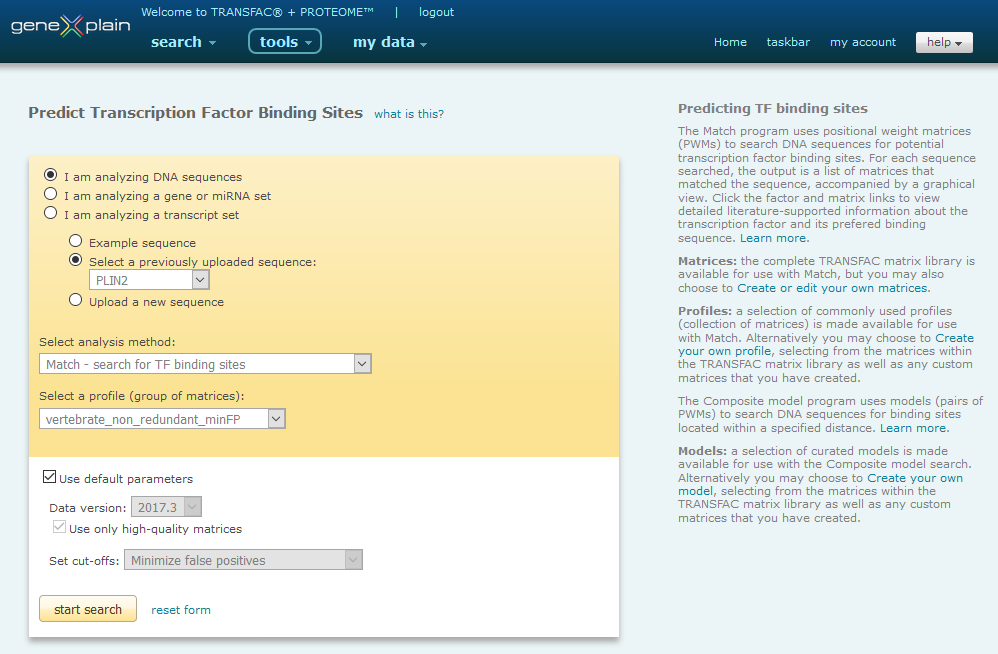
Match Interface
Predicting transcription factor binding sites in a DNA sequence involves six steps:
- 1.Select DNA sequence(s)
- Select the analysis method
- Select a profile (group of matrices)
or model (pair of matrices)
- Set optional parameters
- Start the search
- Save and/or download the result
Select DNA Sequence(s)
There are several options for selecting DNA sequence(s), gene or miRNA sets to search for potential transcription factor binding sites:
-
I am analyzing DNA sequences
-
Select an example sequence
Choose "Example sequence" for test purposes. For Match and Composite Model Search the (new) example sequence is a JUN ChIP-fragment from the human genome in form of genomic coordinates (hg38). For FMatch a larger set of JUN ChIP-fragments in form of genomic coordinates (hg38) has been included as example, while for the example background set the ChIP intervals were shifted by 1000 nucleotides.
-
Select a previously uploaded sequence
Choose "Select a previously uploaded sequence" to select from the sequences that you have uploaded before. This option will only be visible if you have uploaded at least one sequence to your account. If you wish to delete a previously uploaded sequence, locate the sequence within the Gene regulation analysis -> Data -> Sequences folder of the my data menu. (Note: When you delete a sequence, the graphical view of any stored Match result which is based on this sequence will be disabled.) When you used the "Back" button of your browser to return to the Match input page, press the "Reset" button to find the name of your latest uploaded sequence in the list of saved sequences.
-
Upload DNA sequences
-
Click the "Upload a new sequence" link to open a dialog box.
-
Select "I am uploading DNA sequences". That allows you to copy and paste a sequence for upload or to select a file of sequences for upload. The uploaded sequences will be automatically saved to your account in the Gene regulation analysis -> Data -> Sequences folder of the my data menu, so that for further analysis you can select the file under "Select a saved sequence" (option b).
-
Enter a name for your sequence(-set). The sequence(-set) will be stored under that name so it can be used again for a later search. (After the first Match run , the entered sequence(-set) will be available under "Select a saved sequence" (option b)). In case you upload the sequences from a file, the name of the file is automatically copied into the name field.
-
Insert the new sequence by copy and paste or select a sequence file for upload (browse for file).
-
Please note: The total number of nucleotides to be analysed for TF binding sites via the web interface in a single run is limited to 10,000,000 nucleotides. For larger analyses, it is recommended to use Match from command line within the TRANSFAC flat file download.
Supported DNA sequence formats:
Match accepts the following sequence formats: FASTA, GenBank, EMBL and RAW. Examples of each format are provided below. Using the same format for all sequences, it is possible to enter one or several sequences at a time.
Please note: RAW format refers to the pure sequence. Unlike the other formats, where multiple sequences can be entered, sequences entered in RAW format must be entered one at a time.
Sequence Formats
GenBank Format
Only the fields required to recognize an entry in GenBank format are shown. More fields may be included.
LOCUS EXAMPLE 360 bp DNA PLN 13-JUN-1996
ACCESSION K00000
1 ctgcagcccc ggtttcgcaa agttaataat tttcagccgc gcacgtggtt gcccacaggc
61 caccctcctt cccgtcgttt cccatctctt cctcctttag agctaccact atataaatca
121 gggctcattt tctcgctcct cacaggctca tctcgctttg gatcgattgg tttcgtaact
181 ggtgagggac tgagggtctc ggagtggatt gatttgggat tctgttcgaa gatttgcgga
241 ggggggcaat ggcgaccgcg gggaaggtga tcaagtgcaa aggtccgcct tgtttctcct
301 ctgtctcttg atctgactaa tcttggttta tgattcgttg agtaattttg gggaaagctt
//
RAW Format
New lines and white space are ignored.
acacgtagctagctagctgatcgtagctagtcgatcgtagctagctagctgatcgatgctagctgatcgtagctagtcgatag
tctagctagctagtcgatcgtagctagtcgatgctagctagctgtgtgtagctagtcgatcgatgctagctgatcgatcgtaa
gtctgatctagctagctagcgatcgtagctgatcgtagctagcatgctagtcgatgca
-
Upload a new sequence via genomic coordinates in .bed format
-
Click the "Upload a new sequence" link to open a dialog box.
-
Select "I am uploading Genomic intervals for automatic sequence retrieval". That allows you to alternatively copy and paste genomic coordinates in .bed format for upload or to select a .bed file of genomic coordinates for upload. The coordinates will be used to extract the sequence(s) from a local copy of the genome. The extracted sequences will be automatically saved to your account in the Gene regulation analysis -> Data -> Sequences folder of the my data menu, so that for further analysis you can select the file under "Select a saved sequence" (option b).
-
Enter a name for your sequence(-set). The sequence(-set) will be stored under that name so it can be used again for a later search. (After the first Match run, the entered sequence(-set) will be available under "Select a saved sequence" (option b)). In case you upload the intervals from a file, the name of the file is automatically copied into the name field.
-
Insert the intervals by copy and paste or select a .bed file for upload (browse for file).
Please note: Standard .bed format is required. A minimum of four columns of information must be provided in the following order:
Column 1 : chrom - the name of the chromosome. In accordance with .bed standards lower case notation must be used (chr instead of Chr), the X chromosome must be indicated as chrX and not chr23, and the Y chromosome must be indicated as chrY and not chr24.
Column 2 : chromStart - the starting position of the feature in the chromosome. The first base in a chromosome is numbered 0.
Column 3 : chromEnd - the ending position of the feature in the chromosome.
Column 4 : name - defines the name of the sequence.
All other columns will be ignored.
For additional information about standard .bed format, please see the UCSC genome bioinformatics FAQ.Please note: The total number of nucleotides to be analysed for TF binding sites via the web interface in a single run is limited to 10,000,000 nucleotides.
Please note: Upload of sequences via .bed coordinates is only supported for human (hg38/GRCh38), mouse (mm39/GRCm39), rat (rn6/RGSC 6.0), pig (Sscofa11.1), macaque (Mmul8.0.1), Arabidopsis (TAIR10), and fruit fly (BDGP6) genomes.
-
-
I am analyzing a gene or miRNA set
-
Select an example gene
Choose "Example gene" for test purposes. For Match and Composite Model Search the human DHRS3 gene is used as an example. For FMatch a set of human genes associated with angiogenesis is used as an example vs. a subset of housekeeping genes as a background.
-
Select a previously uploaded gene or miRNA set
Choose "Select a previously uploaded gene or miRNA set" to select from the sets that you have uploaded before. This option will only be visible if you have previously uploaded at least one set to your account. The selection list in the interface of the TF-binding site prediction tools of TRANSFAC lists all previously uploaded gene and miRNA sets, regardless, if they have been uploaded via the tool interface (option c) or if they have been uploaded and saved via the main database search or other tools. If you wish to view, rename or delete a previously uploaded gene or miRNA set, locate the set within the Functional analysis -> Data -> Genes and Proteins or miRNAs folder, respectively, of the my data menu. When you used the "Back" button of your browser to return to the Match input page, press the "Reset" button to find the name of your latest uploaded sets in the list of saved gene or miRNA sets.
-
Upload a new gene or miRNA set
Please note: The option to upload a list of genes or miRNAs for binding site prediction is only available for those organisms, for which promoter sequences are provided in TRANSFAC.
-
Click the "Upload a new gene or miRNA set" link to open a dialog box.
-
Select a tab delimited text file for upload.
-
The name of the selected file will be copied automatically to the field were the name is specified under which the uploaded data shall be saved, but it can also be manually modified.
-
Select "I am uploading a list of Genes" or "miRNAs" as appropriate, and "containing Names" or "Identifiers" depending on the data type which you want to use to match the uploaded entities. In case of name matching, you need to specify the species. And in case of identifier matching you need to specify the type of identifier (database).
-
Specify, if the file contains headers.
-
Specify columns: One of the columns recognized in the selected file needs to be selected as "ID" column (containing names or identifiers) for matching. Up to one additional column can be selected as "Observation" to be included in the uploaded data. The matched entities from the gene or miRNA set, including the uploaded ID and optional Observation columns, will be automatically saved to your account in the Functional analysis -> Data -> Genes and Proteins or miRNAs folder, respectively, of the my data menu, so that for further analysis you can select the file under "Select a previously uploaded gene or miRNA set" (option b). The gene and miRNA sets uploaded via the TF binding site predition tools are also available for analysis by other tools in TRANSFAC or PROTEOME.
When gene or miRNA sets are selected for analysis, the user can specify which promoters for the genes are to be included in the analysis (best supported versus all promoters available for the respective gene) and which promoter range. The promoter sequences in TRANSFAC are derived from virtual transcription start sites and span the range of nucleotides from 10,000 bp upstream of the TSS (represented as -10,000 bp) to 1,000 bp downstream of the TSS (represented as +1,000 bp). The "best promoter" is defined as the promoter with the greatest score, or percentage of clustered fragments. For more information about promoters and their features, please see the documentation for the Promoter Report.
-
For FMatch which is used for comparative analysis of a gene set, the default setting is from -500 to +100, while for Match and Composite Model Search, normally used for analysis of single or small sets of genes, the default setting is for the complete range from -10,000 to +1,000.
Please note: The total number of nucleotides to be analysed for TF binding sites via the web interface in a single run is limited to 10,000,000 nucleotides. For larger analyses, it is recommended to use Match from command line within the TRANSFAC flat file download. (Analysis of, e.g., all promoters from human, mouse, or rat, can also be conducted with the Match tool within the ExPlain Analysis System.)
Submission of stored promoter sequence from the TRANSFAC database for TF-binding site prediction
Please note: Besides the analysis of gene or miRNA sets selected or uploaded via the tool interface, as described above, TRANSFAC also provides various options to submit promoter sequences, as far as available, from the database (gene or promoter search, Locus and Promoter Report) via the �Match� shortcut directly to Match and the related tools for TF-binding site prediction, with similar features as in the tool interface.
In this case the Match analysis is initiated via clicking the
![]() Match logo.
TRANSFAC provides promoter sequences 11,000 nucleotides in length
for the following species: human, mouse, rat, Arabidopsis, soybean,
and rice.
Match logo.
TRANSFAC provides promoter sequences 11,000 nucleotides in length
for the following species: human, mouse, rat, Arabidopsis, soybean,
and rice.
Please note: If a gene (or protein) which does not have an associated TRANSFAC provided promoter is selected (for example, an S. cerevisiae gene) a message will be provided indicating that the gene will be skipped. If this happens, and you still wish to search for transcription factor binding sites within the gene's promoter, we recommend that you consult a public sequence repository such as GenBank and then upload the sequence via the Match tool workflow as described above.
Selecting the Analysis Method
Three analysis options are provided:
-
Match - search for TF binding sites
This option uses the Match algorithm, in combination with a selected profile containing a list of matrices and their assigned cut-offs to search for individual transcription factor binding sites that meet the specified cut-offs.
The Match option is recommended when the broadest set of results is desired.
-
Composite model - search by pairs of TFs
This option uses the Composite Model algorithm, in combination with a selected model or models which represent pairs of transcription factors known to act together to coordinately control gene regulation, and their assigned cut-offs to search for pairs of transcription factor binding sites that meet the specified cut-offs.
The Composite Model option is recommended when specific information about coordinate regulation is known, or when more stringent results are desired.
-
FMatch - search for overrepresented TF binding sites
This option is used to find sites which are overrepresented in a set of analyzed sequences (e.g. promoters from differentially expressed genes or ChIP-Seq fragments) in comparison to a background set (e.g. promoters from genes whose expression did not change under the same conditions or random sequences).
Please note: When you select FMatch as analysis option a section opens for specification of the background set, providing the same options for selection or upload of sequences, intervals, or gene and miRNA sets as described above for the experimental or analysis set. Under default parameters, the p-value threshold used by FMatch can viewed and, optionally, changed.
Selecting a Profile (Group of Matrices) or Model (Pair of Matrices)
-
To select a matrix set or profile for Match or FMatch:
Choose from several options to select a matrix set to use to search for potential transcription factor binding sites in the selected sequence:
Selecting Matrices or Profiles provided in Match
Matrices can be selected by taxon (group of organisms) like vertebrates, plants, etc. Due to the large number of vertebrate matrices provided in TRANSFAC, of which many show similar binding motifs, matrices for related factors have been grouped together and the matrices from each group were clustered based on their similarity. From each cluster then one matrix was selected as "representative" of the matrix cluster and their associated factors. These representative matrices were combined in the "vertebrate -non-redundant" profile. Thus, when you work on vertebrate sequences, for many purposes use of the vertebrate-non-redundant profile will be a good comprise. However, the vertebrate-non-redundant profile may not recognize all hits recognized by the full set of vertebrate matrices. Thus, in some cases you may want to either use all available vertebrate matrices or you may want to use a more specific sub-set.
Match provides a number of profiles (matrix sets) specific for a particular (vertebrate) tissue or biological process from which to select. Click here for more information about these TRANSFAC profiles. Further profiles for use in Match can be generated by the user. Profiles generated by the user are listed in the subsection "User defined profiles".
Selecting User-defined Profiles
Choose from the list of user-defined profiles which were generated using the Profile Generation Tool.
-
To select a model for Composite Model Search:
Choose from several options to select a model or models to use to search for potential transcription factor binding sites in the selected sequence:
Selecting Models provided in Composite Model
A set of prepared models, based on TRANSFAC matrix library matrices and TRANSFAC composite elements which define a set of experimentally supported models of coordinate regulation are provided by default. Click the check box next to any number of the models to use them in the analysis. For more details about the composition of the model, click the "(details)" link provided next to the model name.
Selecting User-defined Models
Choose from the list of user-defined models which were generated using the the Composite Model Editor Tool..
Set Optional Parameters
-
1. p-value threshold (for FMatch only)
As FMatch analyzes two sequence or gene sets in comparison, a p-value can be calculated for overrepresentation of sites for particular matrices in the analyzed set versus the background set. FMatch compares the Match result of the two sets and optimizes the cut-offs for each matrix used in the analysis to reach the best separation between the two sets. Only those matrices appear in the FMatch result, for which the p-value for over- or underrepresentation of the sites in the experimental set fit the p-value threshold.
-
Selecting a version
As of the the 2013.3 release, in an effort to provide support for data replication for publication purposes, we introduced support for older matrix library versions. The current matrix library is always selected by default, but you may choose to use an older matrix library version as desired.
-
Exclusion of Low-Quality Matrices (for Match or FMatch)
Check the option to "Use only high quality matrices", if you want to exclude matrices (from pre-defined profiles) which generate particularly high numbers of false positives. Details on the high/low quality criterion are described here. For user generated profiles this option is not available, to prevent that some of the matrices selected by the user are accidentally excluded from the analysis, i.e. all matrices from the user profile are used in the analysis.
-
Selecting Cut-offs (for Match or FMatch)
The matrix similarity score describes the quality of a match between a matrix and an arbitrary part of the input sequence. Analogously, the core similarity score denotes the quality of a match between the core sequence of a matrix (defined as the five most conserved consecutive positions within a matrix) and a part of the input sequence. A match has to contain the "core sequence" of a matrix. In other words, the core sequence has to match with a score higher than or equal to the core similarity cut-off. In addition, only those matches which score higher than or equal to the matrix similarity threshold appear in the output.
The appropriate cut-off selection is very important and depends largely on the user's objectives. Exact matches between matrix and sequence can lack any biological relevance since some transcription factors have low affinity binding sites of biological significance. So, we have calculated three different kinds of cut-offs, each meeting a different requirement. Use cut-offs to:
- Minimize false positive matches (minFP)
- Minimize false negative matches (minFN)
- Minimize the sum of both error rates (minSUM)
It is also possible to define a core and a matrix similarity cut-off which are used for all matrices of the selected group. (Exceptions are the three "non-redundant-profiles" which are associated with fixed cut-offs.) Additional details about cut-offs are provided here. For user-defined profiles the cut-offs are taken by default from the profile, i.e. those cut-offs are used which were defined during profile generation in the Profile Generation Tool.
Please note: For FMatch it is recommended to use (primary) cut-offs which are not too stringent. Based on the result from the primary cut-offs, the tool optimizes the cut-offs and only matrices for which overrepresentation of hits fit the p-value threshold will be included in the result.
Start the Search
Click "Start search", and a results page will open.
On top of the result page a summary of the result is given with the total sequence length (the sum of all included sequences) which has been searched, the total number of sites that have been found in the analyzed sequences and the frequency of sites per nucleotide.
Underneath, for Match and FMatch, a matrix summary lists the total (or relative) number of hits for each matrix in the result, while for Composite Model Search, a model summary lists the number of hits found for each model present in the analysis.
Finally, a sequence summary lists the analyzed sequences with individual hits. Click on individual sequence IDs for a tabular and graphical view of the distribution of the sites in the individual sequence. Note: In case of FMatch, you can switch in the sequence summary between the experimental set and the background set.
Match, FMatch and Composite Model analysis results
The results are presented in the respective analysis report which is comprised of three sections:
-
Analysis summary
The Analysis summary section provides an overview of the count of sequences analyzed, the number of sites found, etc. A summary of parameters used in the analysis is accessed by clicking the "Show parameters use" link. In the FMatch Analysis Report the Analysis Summary contains a summary on the Experimental data set, as well as a summary on the Background data set. Note: The FMatch result is based on the optimized cut-offs (above the primary cut-offs) and the p-value threshold.
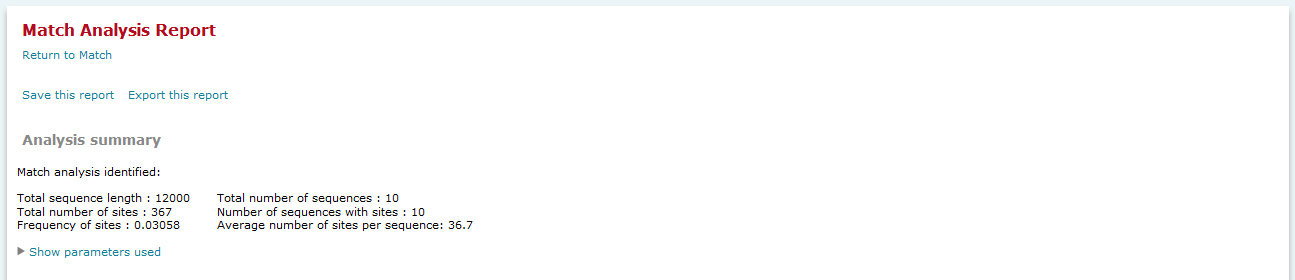
Match analysis results, Analysis summary
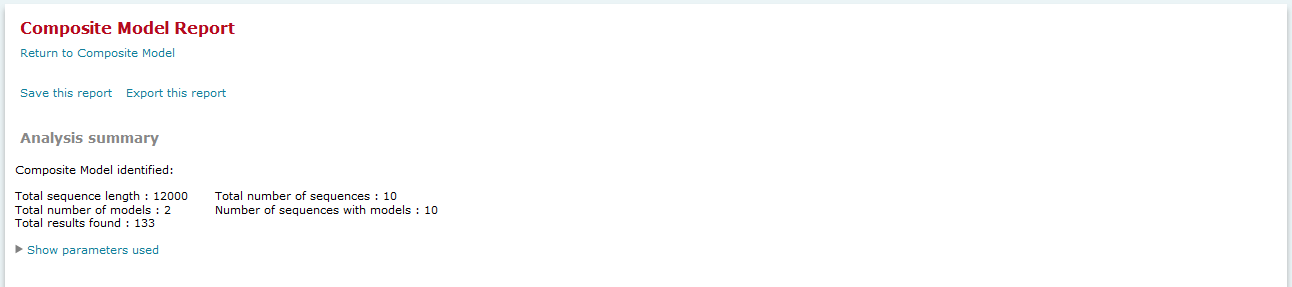
Composite Model analysis results, Analysis summary
-
Matrix summary (Match, FMatch), Model summary (Composite Model)
For Match results, the Matrix summary section provides an overview of the matrices for which at least one binding site was predicted.
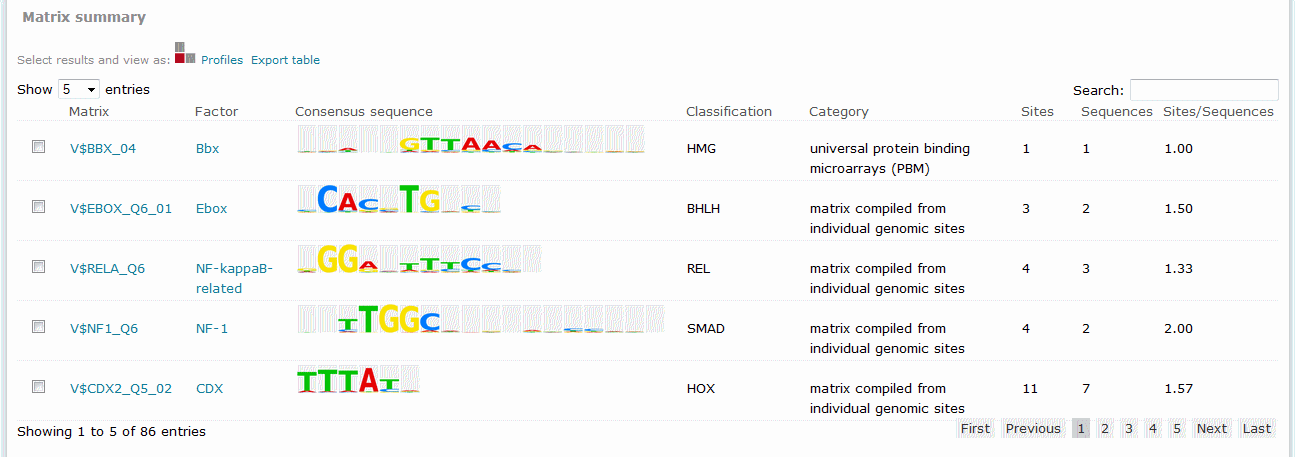
Match analysis results, Matrix summary
The columns of the table are:
Matrix
Identifies the respective matrix and either provides a hyperlink to the corresponding TRANSFAC Matrix Report or, in the case of user-defined matrix, displays the name of the user matrix.
Factor
Lists the name of the factor, or factor family, whose binding site is represented by the matrix. (Note: A matrix can have several factors linked, e.g. isoforms expressed by the same gene, orthologous factors from related species, or in some cases paralogous factors with similar binding specificity. To get a full list of all factors represented by the matrix, please refer to the factors linked in the respective Matrix Report, which you can reach via the hyperlink in the first column of the Match result (Matrix Id). Or To view all factors which are linked to the matrix, either click on the matrix ID (first column) to open the Matrix Report or click on the factor name (last column of the Match result)to invoke a database search for the factors linked to the matrix. The latter starts a database search for the factors which are linked to the selected matrix. The result of the database search lists the factors (Name, Species, Type, Encoding gene, and all matrices linked to the factor). The factor name is hyperlinked to the corresponding Locus Report for that transcription factor. Selected factors from the database search result, associated with a particular matrix, can be used for further data retrieval or analysis, using the respective functions on the search result page.) Note: In case of the vertebrate non redundant profile, the factor name associated with the matrix is replaced by the group name for which the matrix is a representative and the database search invoked by clicking on this group name will not only find the factors directly linked to this matrix, but also factors linked to other matrices from the same cluster for which the selected matrix is a representative.
Consensus sequence
Displays a graphical representation of the matrix consensus sequence.
Classification
Displays the family that the matrix has been classified as belonging to, if determined.
Category
Describes the method used to create the matrix.
Experimental support
When available, provides a link to a pop-up window which lists supporting lines of evidence from the scientific literature supporting a possible biological connection between the factor and the gene. Supporting lines of evidence may include demonstration of binding between the factor and gene at any genomic location within the region of the gene as well as functional studies that show an effect on expression of the gene when the transcription factor is knocked out or over expressed. Please note that the data has been abstracted such that evidence will be presented in cases where the published factor or gene was the ortholog of the factor or gene represented in the analysis report. For example, if the literature reports that human p53 binds human BRCA1 this line of evidence will be reported in analysis reports for human BRCA1, mouse Brca1 and rat Brca1.
Sites
Provides the count of total binding sites predicted for the matrix across all sequences within the analysis.
Sequences
Provides the count of sequences within the sequence set for which at least one binding site was predicted for the matrix.
Sites per sequence
Provides the average number of binding sites predicted for the matrix per sequences within the sequence set.
Factor's EntrezGene ID
Provides the EntrezGene ID for the factors that are represented by the matrix.
Factor's UniProt ID
Provides the UniProt ID for the factors that are represented by the matrix.
Associated factors
Lists the factors that are represented by the matrix.
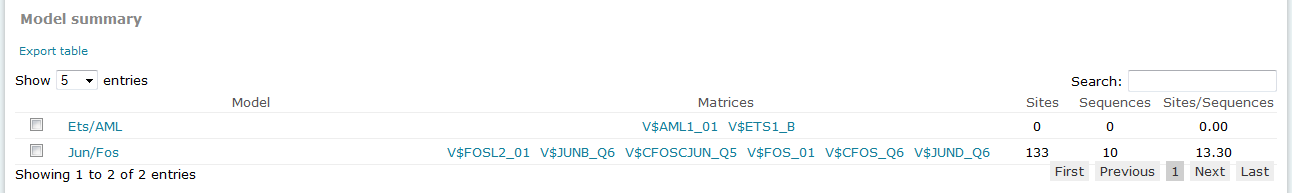
For Composite Model results, the Model summary section provides an overview of results for each model considered in the analysis.
Composite Model analysis results, Model summary
The columns of the table are:
Model
Provides the name of the model. To view the complete details of the model, click the name to open the model in the model editor tool.
Matrices
Lists the matrices which compose the model. Click the linked matrix name to view complete details of the matrix in its associated Matrix Report.
Sites
Provides the count of total binding sites predicted for the model across all sequences within the analysis.
Sequences
Provides the count of sequences within the sequence set for which at least one binding site was predicted for the model.
Sites per sequence
Provides the average number of binding sites predicted for the model per sequences within the sequence set.
FMatch analysis results, Matrix summary
For FMatch results, the Matrix summary section provides an overview of the matrices for which at the optimized cut-offs the over- or underrepresentation of sites in the experimental data set versus the background data set fit the p-value threshold.
The columns of the table are:
Matrix
Identifies the respective matrix and either provides a hyperlink to the corresponding TRANSFAC Matrix Report or, in the case of user-defined matrix, displays the name of the user matrix.
Factor
Lists the name of the factor, or factor family, whose binding site is represented by the matrix. (Note: A matrix can have several factors linked, e.g. isoforms expressed by the same gene, orthologous factors from related species, or in some cases paralogous factors with similar binding specificity. To get a full list of all factors represented by the matrix, please refer to the factors linked in the respective Matrix Report, which you can reach via the hyperlink in the first column of the Match result (Matrix Id). Or click on the factor nameto invoke a database search for the factors linked to the matrix. The result of the database search lists the factors (Name, Species, Type, Encoding gene, and all matrices linked to the factor). The factor name is hyperlinked to the corresponding Locus Report for that transcription factor. Selected factors from the database search result, associated with a particular matrix, can be used for further data retrieval or analysis, using the respective functions on the search result page.) Note: In case of the vertebrate non redundant profile, the factor name associated with the matrix is replaced by the group name for which the matrix is a representative and the database search invoked by clicking on this group name will not only find the factors directly linked to this matrix, but also factors linked to other matrices from the same cluster for which the selected matrix is a representative.
Graph
Displays the relative number of sites for the selected matrix in the experimental data set (green bar) versus in the background set (red bar).
Yes
The relative number of sites for the selected matrix in the experimental data set.
No
The relative number of sites for the selected matrix in the background data set.
Yes/No
The ratio of the relative number of sites for the selected matrix in the experimental data set divided by the relative number of sites in the background data set.
Matched promoters in Yes
The relative number of sequences/promoters in the experimental data set with at least on site for the selected matrix.
Matched promoters in No
The relative number of sequences/promoters in the background data set with at least on site for the selected matrix.
Hidden columns which can be included optionally:
CSS
Optimized core similarity score cut-off calculated by FMatch for the selected matrix.
MSS
Optimized matrix similarity score cut-off calculated by FMatch for the selected matrix.
p-Value
p-Value for over- or underrepresentation of sites for the selected matrix in the experimental data set versus the background data set at the optimized cut-offs. (Note: Only matrices are included in the FMatch result, for which this p-Value is below the p-value threshold used in the FMatch analysis.)
Matched promoters p-Value
p-Value for over- or underrepresentation of sequences/promoters with at least one site for the selected matrix in the experimental data set versus the background data set at the optimized cut-offs.
Factor�s EntrezGene ID
EntrezGene IDs of the factors linked to the matrix
Factor�s UniProt ID
UniProt IDs of the factors linked to the matrix
Associated Factors
Names of the factors associated with the matrix
Classification
Displays the family that the matrix has been classified as belonging to, if determined.
Category
Describes the method used to create the matrix.
Consensus sequence
Displays a graphical representation of the matrix consensus sequence.
-
Sequence summary
For Match and FMatch results, the Sequence summary section provides, for each sequence analyzed, a graphical display of the predicted binding sites and a tabular summary. Note: In the Sequence Summary of the FMatch Report, you can switch between the Experimental set and the Background set.
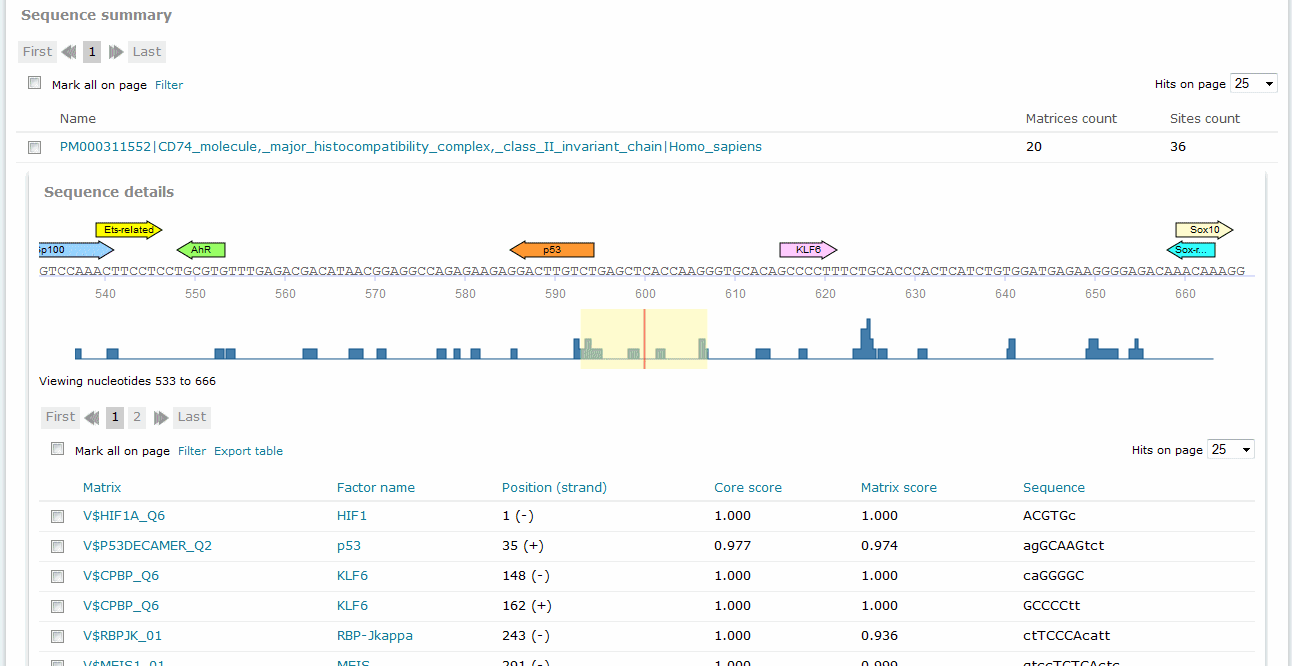
Match analysis results, Sequence summary
If you have submitted more than one sequence for analysis,click the sequence name to view the binding sites graphical display and tabular summary. If you have submitted only one sequence for analysis the view will open automatically.
The columns of the table are:
Matrix
Identifies the respective matrix and either provides a hyperlink to the corresponding TRANSFAC Matrix Report or, in the case of user-defined matrix, displays the name of the user matrix.
Factor
Lists the name of the factor, or factor family, whose binding site is represented by the matrix. (Note: A matrix can have several factors linked, e.g. isoforms expressed by the same gene, orthologous factors from related species, or in some cases paralogous factors with similar binding specificity. To get a full list of all factors represented by the matrix, please refer to the factors linked in the respective Matrix Report, which you can reach via the hyperlink in the first column of the Match result (Matrix Id). Or click on the factor nameto invoke a database search for the factors linked to the matrix. The result of the database search lists the factors (Name, Species, Type, Encoding gene, and all matrices linked to the factor). The factor name is hyperlinked to the corresponding Locus Report for that transcription factor. Selected factors from the database search result, associated with a particular matrix, can be used for further data retrieval or analysis, using the respective functions on the search result page.) Note: In case of the vertebrate non redundant profile, the factor name associated with the matrix is replaced by the group name for which the matrix is a representative and the database search invoked by clicking on this group name will not only find the factors directly linked to this matrix, but also factors linked to other matrices from the same cluster for which the selected matrix is a representative.
Position (strand)
Indicates the starting position of the match in the input sequence and the strand, (+) or (-), on which it can be found. Note: For results of analyzed DNA sequences relative positions are given. In case of analyzed genomic intervals or promoter sequences submitted from TRANSFAC, genomic coordinates are provided.
Core score
Indicates the score for core similarity (core match).
Matrix score
Indicates the score for matrix similarity (matrix match).
Sequence
Identifies the portion of the input sequence that was identified as the binding site. Capital letters indicate the positions in the sequence that match with the core sequence of the matrix, while the lower case letters refer to positions which match to other parts of the matrix. (Note: The matrix can also contain highly conserved positions outside the core of the matrix.).
Experimental support
When available, provides a link to a pop-up window which lists supporting lines of evidence from the scientific literature supporting a possible biological connection between the factor and the gene. Supporting lines of evidence may include demonstration of binding between the factor and gene at any genomic location within the region of the gene as well as functional studies that show an effect on expression of the gene when the transcription factor is knocked out or over expressed. Please note that the data has been abstracted such that evidence will be presented in cases where the published factor or gene was the ortholog of the factor or gene represented in the analysis report. For example, if the literature reports that human p53 binds human BRCA1 this line of evidence will be reported in analysis reports for human BRCA1, mouse Brca1 and rat Brca1.
Sequence view
In the graphical output, the predicted sites are shown as arrows above the respective part of the sequence with the factor name printed within the arrow. Click the arrow to open a pop-up window which summarizes the binding site information and provides a hyperlink to the corresponding Matrix Report.
Note: The graphical output shows the reference strand of the genome, regardless of the orientation of an analyzed gene promoter. In case for a list of genes promoters from TRANSFAC were analyzed, location and direction of the TSS are indicated by an angled arrow.
Filter by intervals:
When the genomic coordinates of the analyzed sequences are known either via .bed coordinate upload or via the use of stored TRANSFAC promoters, the binding sites predicted with Match, CMsearch or FMatch can be filtered by intervals from the database: ChIP fragments (Binding fragments for transcription factors from ChIP-seq or similar experiments), DNase hypersensitivity sites or Phastcons intervals (intervals of conservation, as determined by 46-way phastcons and 60-way phastcons placental mammals tracks for human and mouse at UCSC ). The location of the selected intervals/features is displayed by color-coded bars underneath the analyzed sequence and gray lines in the frequency bar. When one of these features is selected, all hits outside the respective intervals are excluded from the result. When more than one feature is selected at the same time, all hits outside the intersection of the intervals are excluded from the result. For the filtering, the matrix (and model) hits are allowed to extend up to three nucleotides outside the intervals.
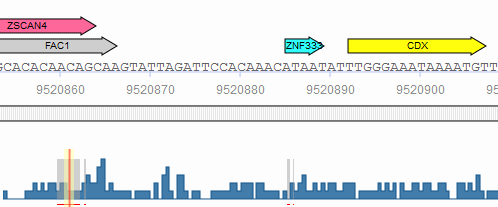
Match phastcons intervals
The subset of interval data to be used can be specified using the "filter" link next to the desired data type. Clicking the link opens the filter dialog window which can be used to select the specific experiments to include in the filter. For example, you may want to limit the filter to only those ChIP intervals identified in fibroblast cell lines.
For Composite Model results, the Sequence summary section provides, for each sequence analyzed, a graphical display of the predicted binding sites and a tabular summary.
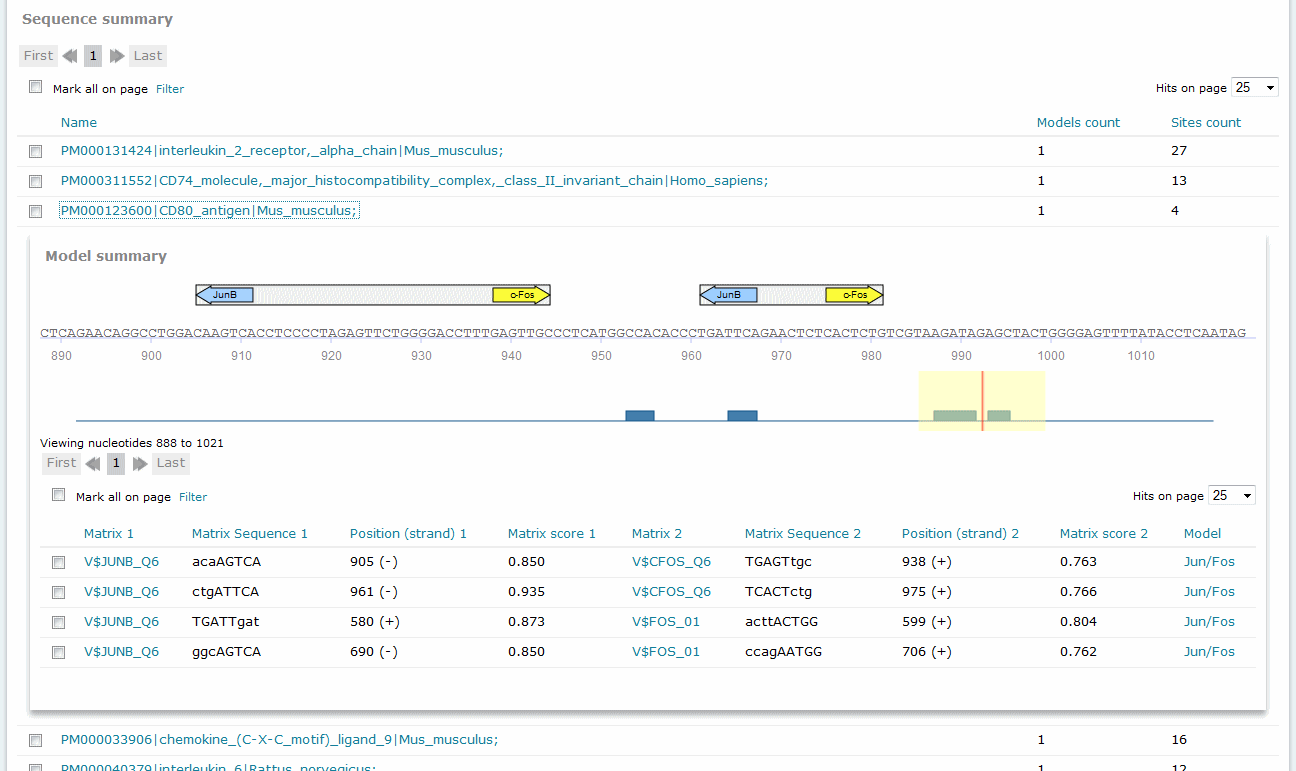
Composite Model analysis results, Sequence summary
If you have submitted more than one sequence for analysis,click the sequence name to view the binding sites graphical display and tabular summary. If you have submitted only one sequence for analysis the view will open automatically.
The columns of the table are:
Matrix 1, Matrix 2
Identifies the respective matrix and either provides a hyperlink to the corresponding TRANSFAC Matrix Report or, in the case of user-defined matrix, displays the name of the user matrix.
Sequence 1, Sequence 2
Identifies the matching sequence. Capital letters indicate the positions in the sequence that match with the core sequence of the matrix, while the lower case letters refer to positions which match to other parts of the matrix. (Note: The matrix can also contain highly conserved positions outside the core of the matrix.)
Position (strand) 1, Position (strand) 2
Indicates the starting position of the match in the input sequence and the strand, (+) or (-), on which it can be found.
Matrix score 1, Matrix score 2
Indicates the score for matrix similarity (matrix match).
Model
Provides the name of the model. To view the complete details of the model, click the name to open the model in the model editor tool.
-
Saving the Results
To save a Match or Composite Model result, click the "Save this report" link at the top of the report.
Downloading the Results
Use the "Export this report" button to download the tabular Match result in form of a text file, which can be opened with a text editor.
For FMatch the downloaded result contains three files: Experimental.out contains the Match result for the experimental data set filtered by the optimized cut-offs and p-value threshold. Background.out contains the Match result for the background data set filtered by the optimized cut-offs and p-value threshold. fmatch.out contains the main columns of the matrix summary of the FMatch result, i.e. filtered by the optimized cut-offs and p-value threshold.
Manage / View Saved Results
Saved Match analysis results are stored, and accessed from, the Gene regulation analysis -> Analysis results -> Match results folder of the my data menu. Click on the desired entry to view the analysis report or click the red "x" to delete the report.
Manage Saved Sequences
Uploaded sequences are stored, and accessed from, the Gene regulation analysis -> Data -> Sequences folder of the My Data menu. Click on the desired entry to view a summary of the sequence or set of sequences represented or click the red "x" to delete the sequence(s).
Filter result and submit to additional analyses
On the Matrix Summary (or Model Summary) and Sequence Summary filters can be applied on each column. If matrices are marked in the Matrix Summary (e.g. based on an applied filter) and the export table function is used, the export is restricted to the marked matrices. Similarly, marking of matrices in the Matrix Summary, automatically adapts the result in Sequence Summary accordingly, i.e. only matches for the marked matrices are listed. This allows to filter the sequences by hits for particular matrices: 1. (optionally) Filter matrix summary for particular matrices or matrices with certain number of hits, etc. 2. Mark the respective matrices. 3. Filter the Sequence Summary by hits for at least one matrix (matrices > 0) 4. Set hits on page for the Sequence Summary to �all� 5. Mark all. 6. Submit the gene list (only available for analyzed genes and genomic intervals mapped to promoters) to Ontology Search or to Functional Analysis (only available in products including PROTEOME).