Hand-drawn Pathway Maps in TRANSPATH
Signaling pathways can be visualized, and the display manipulated to customize the view, using the BKL Pathfinder. In addition, interactive pathway maps that provide a broad overview of a particular signaling pathway are provided in TRANSPATH. Hand-drawn maps can be accessed by topic, as shown in the figure below.
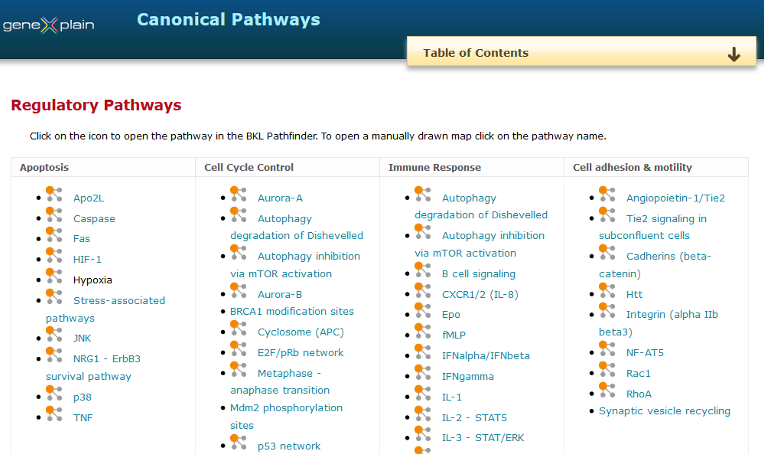
Part of the overview page that allows access to hand-drawn maps in TRANSPATH (by topic). Alternatively, the pathways can be viewed with the BKL Pathfinder by clicking on the icons.
Click on hyperlinked pathway names to access the interactive map. An example of the p53 network is shown below.
Hand-drawn Maps of the p53 network
Click on any molecule on the map to access the corresponding Locus, Complex, or Small Molecule Report. Click "p53 pathway entry" to access the Pathway Report. Molecules in the interactive map are color coded, as shown below.
Color coding of molecules in pathway maps
In addition to being organized by topic, the list of hand-drawn maps is also organized by extracellular signaling molecule, cell surface receptor, signal transduction molecule, transcription factor, and physiological context. Click here to access the hand-drawn maps, or search for them using the BKL Tools.