Transcription Profile Report
Transcription Profile Reports contain information collected from studies using various technologies:
- high-density oligonucleotide microarrays
- DNA microarrays (PCR-generated DNA fragments spotted on glass
support)
- filter arrays (PCR-generated DNA fragments spotted on hybridization filters)
For additional details about functional genomics information curated in the Proteome Databases, click here.
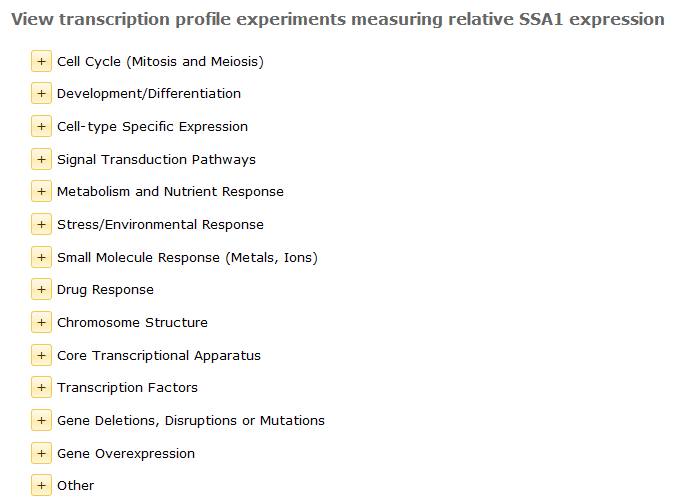
Transcription Profile Reports are accessed from Locus Reports in the Proteome Databases. The Locus Report hyperlinks to a Transcription Profiling Experiment Index that contains a list of profile categories, as shown below.
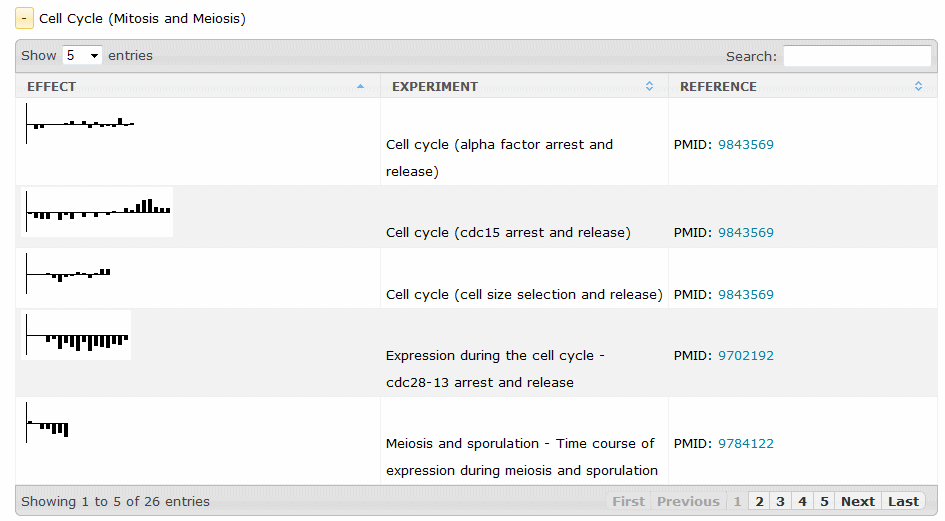
Each category expands to a list of profiling experiments available for the gene.
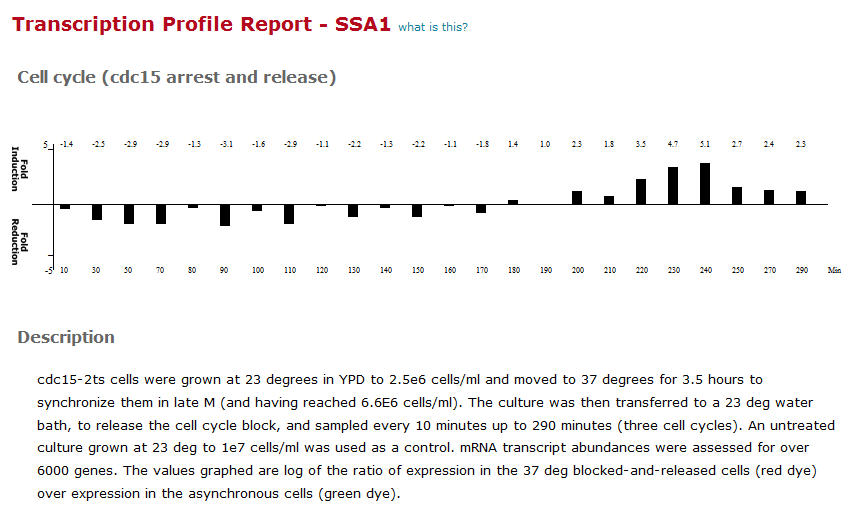
Each experiment has a thumbnail that shows the result (fold-change for single-point data sets, or a graph for multipoint data sets) and brings up the Transcription Profile Report, shown here:
Transcript Profile Matching Search
From the bottom of each transcript profile report you may launch a search for other genes that exhibit a similar expression profile under the same experimental conditions.
Profiles are ranked by a two step process in which first a similarity score is determined, then second a 'cluster' analysis groups highly related profiles. Thus the matches may not necessarily be ranked in strict order of increasing similarity score.
Scoring is based on:
- matching the heights of the bars in the histogram, and
- matching the size of the steps between the bars
Scores reflect the difference in heights (or steps); generally scores below 1.0 are good matches. A score of zero reflects a perfect match.
After scores are assigned, the clustering algorithm is applied so that profiles which have similar patterns are presented together. Profiles that deviate from perfect representations of the model profile appear as 'families', and each deviates according to a common pattern. Members within each family are ranked according to similarity score.
For presentation the entire analysed set is divided into quarters according to their computed similarity score. Members of families that have the same quartile ranking are held together. The families are displayed according to similarity to the model profile. Individual members of the families are ranked according to similarity score. Top quartile family members are displayed first. Following them are the members of the same families (if any) or members of additional families that have second quartile scores. The process is repeated for those of third and fourth quartiles.


